This case study is designed to help you better understand your results if you’ve just received our AEO review. We’ll use this example to walk you through how the evaluation works.
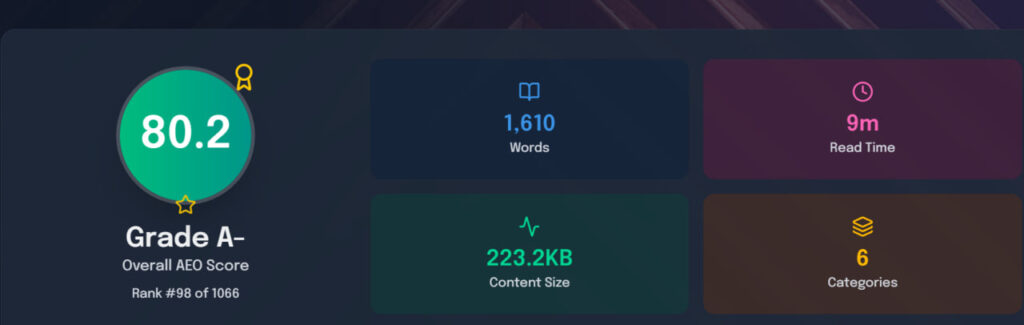
Overall, this website is performing strongly. It has an AEO score of 80.2, a Grade A-, and ranks #98 out of 1,066—placing it ahead of the majority of benchmarked pages. In simple terms, the content is already well-optimized and effective. However, there is still opportunity to refine it further by improving clarity, enhancing completeness, and making it even more accessible for answer engines to interpret and surface.
What the main score means
The overall AEO score is the headline indicator of how well the page is optimized for answer engines and AI search visibility. A score above 80 usually means the content is doing many things right: it is likely structured well, reasonably comprehensive, and more likely to be cited or summarized by AI systems.
The Grade A- means the page is high quality, but not perfect. Think of it as “excellent, but not fully optimized yet.”
The rank of #98 of 1066 is also a good sign because it places the page near the top of the dataset. The lower the rank number, the better the page is performing relative to others.
What each category means
The image also shows several content metrics that help explain why the score is what it is.
- Words: 1,610
This measures how much text is on the page. A word count like this often suggests enough depth to cover a topic properly, as long as the writing stays focused and useful. - Read Time: 9m
This is the estimated time it takes a reader to go through the content. A 9-minute read usually means the page is substantial, which can be good for topic coverage, but it should still be easy to scan. - Content Size: 223.2KB
This reflects how heavy the page is. A smaller, efficient page is often easier to load and use, while a larger one may contain images, scripts, or extra elements that affect speed. - Categories: 6
This suggests the page has been grouped into six topical sections or themes. That is helpful when the categories are distinct and logically organized, because AEO works best when content is structured clearly for machines and people.
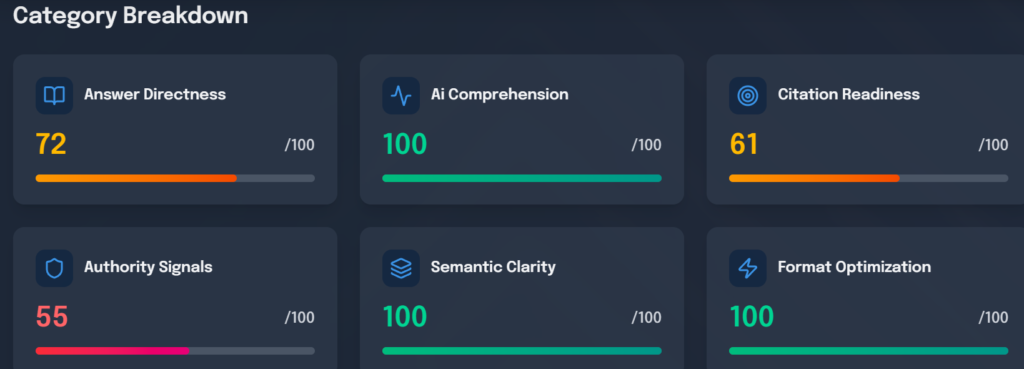
These are AEO-specific metrics (out of 100) that score how well the page is optimized for AI answer engines to understand, cite, and use your content. The page shows mixed but promising results: strong in AI comprehension (100) and format (100), but room to grow in authority (55) and citation readiness (61)
Answer Directness
Score: 72 – Measures how directly and quickly the page answers key questions.
- High score if answers appear early and clearly (e.g., TL;DR or first paragraph).
- 72 is decent but could improve by leading with concise answers.
AI Comprehension
Score: 100 – How easily AI systems parse and interpret the content.
- Perfect score means clear language, logical flow, and no ambiguity for models like ChatGPT.
- Excellent: AI can fully “get” your page.
Citation Readiness
Score: 61 – Likelihood of being cited or quoted by AI in responses.
- Factors: verifiable data, sources, structure for extraction.
- 61 suggests moderate potential; add citations/schema to boost.
Authority Signals
Score: 55 – Strength of trust/credibility indicators like E-E-A-T (expertise, experience, authoritativeness, trustworthiness).
- Includes author bios, sources, schema markup.
- Lowest score (red): Needs more expert attribution or data backing.
Semantic Clarity
Score: 100 – How clearly the page conveys meaning using entities, context, and relationships.
- Perfect: Strong topical focus, related terms, no confusion.
- Top marks for AI semantic understanding.
Format Optimization
Score: 100 – How AI-friendly the structure is (headings, lists, tables, schema).
The colorful dashboard makes weak spots (red/orange) obvious for quick fixes.
How to judge whether the analysis is good
A website is usually well analysed when it performs well in these areas:
- It gives a direct answer early in the page.
- It uses clear headings and logical structure so the topic is easy to understand.
- It has enough depth to answer the main question and related questions.
- It stays concise and readable, without unnecessary fluff.
- It is easy for AI systems to extract and summarize.
So based on this image, the website appears to be well-optimized and above average, but not yet fully polished.
SEO optimization scores
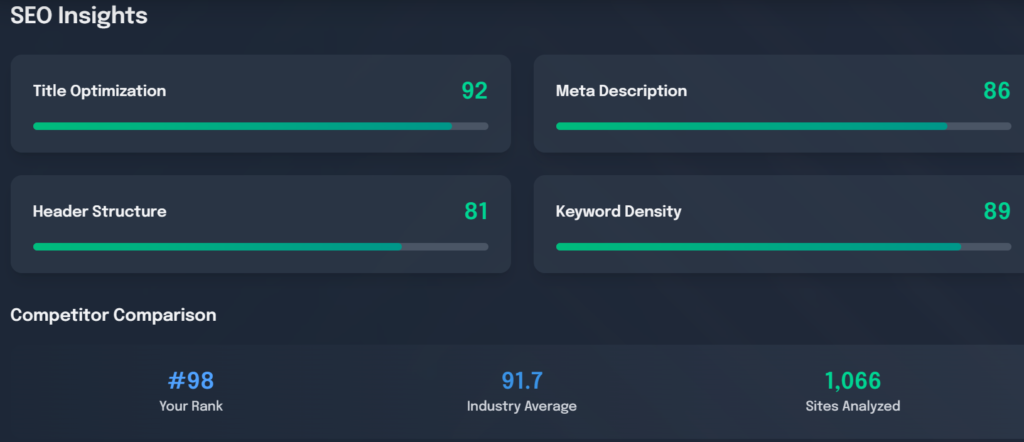
These are SEO optimization scores (out of 100) for how well the page uses key on-page elements to rank in search. They show the page is very strong overall (e.g., 92 for title, #98 rank), beating industry benchmarks.
Title Optimization
Score: 92 – Measures how well the page title tag is set up for SEO.
- Good titles are 50-60 characters, include main keywords early, and are clickable.
- A 92 means it is nearly perfect: relevant, keyword-rich, and compelling.
Meta Description
Score: 66 – Rates the meta description tag quality.
- Ideal: 140-160 characters, persuasive, with keywords and a call to action.
- 66 suggests it is okay but could be more engaging or keyword-focused to boost click-through rates.
Header Structure
Score: 81 – Evaluates H1-H6 tag usage and hierarchy.
- Strong structure uses one H1, logical H2/H3 progression for scannability and topic clarity.
- 81 is solid: good organization, but maybe add more subheadings or keyword matches.
Keyword Density
Score: 89 – Checks how often target keywords appear relative to total words.
Competitor Comparison
Your Rank: #98 – How this page stacks up against similar pages.
Industry Average
91.7 – Benchmark score for pages in your industry/sector.
Sites Analyzed
1,066 – Total number of competitor or industry pages the tool compared against.
How to measure if it is going well
This page is excelling in SEO: high scores (average ~80+), top competitor rank, and above industry average.
- Strengths: Title, keywords, headers, rank.
- Improve: Meta description for better clicks.
- Overall: Strong setup for search visibility.
The image dashboard highlights these as green bars, confirming solid optimization across the board.
General (non-customise) tips for improvement
Here is the most practical way to improve a page like this:
- Make the first section answer the main question immediately.
AEO content performs better when it gives a clear, direct answer near the top. - Strengthen headings and section order.
Use simple, descriptive headings so each section can stand on its own. - Add missing supporting detail.
Include examples, FAQs, comparisons, or short explanations where users may still have questions. - Remove fluff and repetition.
AEO content should be direct, specific, and easy to extract. - Improve page efficiency.
Reduce unnecessary file weight if content size is high, especially if images or scripts slow the page down. - Aim for “short but not shallow.”
Good AEO content is concise enough for quick answers, but detailed enough to stay useful.
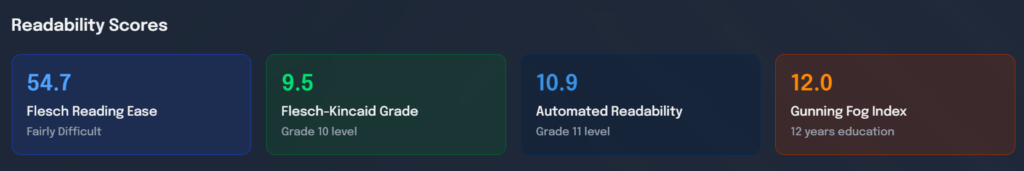
Readability Scores
These are readability scores that estimate how easy a piece of writing is to understand.
Flesch Reading Ease
This gives text a score from 0 to 100, where higher = easier to read. It is based mainly on sentence length and syllables per word.
- Higher score = simpler, more readable text.
- Lower score = more complex, harder text.
Flesch-Kincaid Grade
This converts readability into a U.S. school grade level. It estimates what education level a reader needs to understand the text.
- Grade 6 means around 6th-grade reading level.
- Grade 10 means around 10th-grade reading level.
Automated Readability Index
The Automated Readability Index (ARI) also estimates grade level, but it uses characters per word and words per sentence instead of syllables. It was designed to make readability scoring easier to automate.
- Lower ARI = easier text.
- Higher ARI = harder text.
Gunning Fog Index
The Gunning Fog Index estimates how many years of education a reader needs to understand the text on first read. It uses average sentence length and the percentage of complex words.
- A fog score of 8 is generally considered fairly easy.
- A fog score of 12 is more like high school level.
In plain language
If you are checking website content:
- Flesch Reading Ease tells you how easy the text feels.
- Flesch-Kincaid tells you the grade level.
- ARI tells you grade level using word length and sentence length.
- Gunning Fog tells you how much education the reader may need.
So, why is it based on U.S. readable standard? The reason is mostly history and standardization: the formulas were created in the U.S., for U.S. institutions, and later spread widely in that form. They are useful, but they should be treated as approximate readability indicators, not absolute truth. A score like “grade 8” means “about 8th-grade reading level” in the U.S. system, not necessarily the same thing in Singapore, the UK, or elsewhere. The formulas still help as a rough readability guide, but they do not perfectly measure comprehension across different cultures, curricula, or native-language backgrounds.
Simple rule of thumb
If you want a quick way to read this report:
- 80+ score = strong page.
- A- grade = very good, but still improvable.
- Top 10% rank = competitive content.
- 1,610 words and 9 minutes = decent depth, as long as the structure is clean.
- 6 categories = good if the categories are well organized and not repetitive.
It’s important to note that the evaluation is typically based on the exact page or URL you submitted—not the entire website by default.
So, if you entered a homepage or a specific landing page, the score you’re seeing most likely reflects only that page’s content quality, structure, and formatting, rather than the performance of every page across the domain.
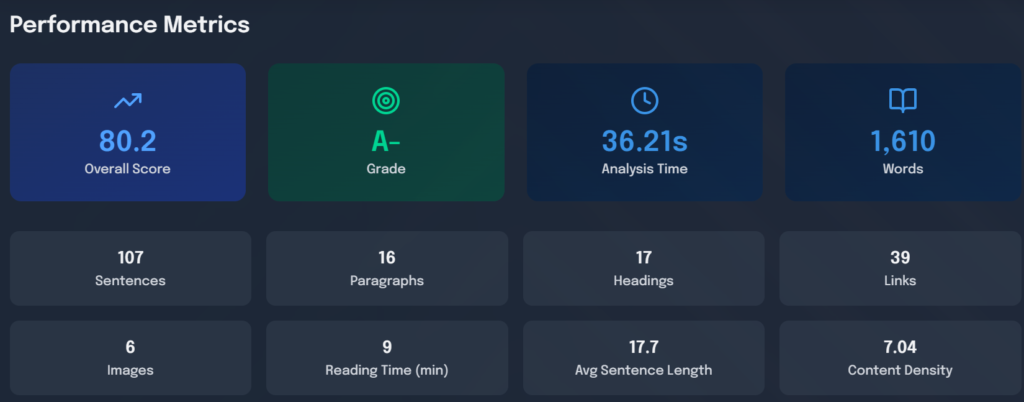
Performance Metrics
Analysis Time
This is simply how long the analysis tool needed to process the page.
Analysis time is the time the tool took to analyze the page, which is 36.2 seconds in the image, and it does not directly affect content quality. The other metrics measure how well the page is structured and readable, so you judge them by checking if they show balanced, user-friendly content. It does not reflect page performance, just tool processing time.
Sentences, Paragraphs, Headings, Links
These are raw counts of structural elements.
- Sentences: 107 – Number of sentences. Judge by balance: too few may mean long, hard-to-read blocks; too many short ones can feel choppy.
- Paragraphs: 16 – Number of paragraphs. Good if they are short (3-5 sentences each) for easy reading.
- Headings: 17 – Number of H1-H6 tags. Ideal for AEO: enough to organize content clearly without overusing.
- Links: 39 – Number of hyperlinks. Judge by usefulness: relevant internal/external links help SEO, but too many can distract.
Images
Images: 6 – Number of images on the page.
- Good if they add value (e.g., visuals for content), are optimized (not slowing load), and have alt text for accessibility/SEO.
Reading Time
Reading Time: 9m – Estimated time to read all text at average speed.
- 9 minutes is solid for in-depth content; shorter (under 5m) for quick answers, longer for guides.
Average Sentence Length
Avg Sentence Length: 17.7 – Average words per sentence.
- 17.7 words is good: under 20 is easy to read; over 25 gets hard.
Content Density
Content Density: 7.04 – Likely words per paragraph or similar density ratio.
- Around 7 is balanced: dense enough for info, not overwhelming; too high can feel packed.
How to measure if it is going well
This page looks well-structured overall: balanced counts, readable sentences, and good density.
- Green flags: 17 headings for structure, short sentences, reasonable images/links.
- Watch: Ensure paragraphs are scannable and links/images support the text.
- Rule: If metrics support an 80.2 score and A grade, it is performing strongly.
The image shows these metrics in a clean dashboard, which makes it easy to spot strengths like the heading count.
Metrics such as word count, estimated read time, content size, and category classification are generally calculated at the page level.
While the report is useful for understanding how that specific page performs, it shouldn’t be taken as a full representation of your website’s overall AEO health—unless the tool clearly indicates that a complete sitewide crawl was conducted.
If this still feels too technical or overwhelming, you don’t have to figure it out alone. Book a consultation with Irene for a clear, simplified breakdown tailored to your business—or let us handle everything for you. We’ll build and optimize your AEO system so you can improve visibility without overthinking the process.
Simple, strategic, and done right—so you can focus on what you do best.